Why Investors Should Look Forward After the Recent Muni Selloff
GW&K Municipal Insights | October 2026
Municipal bonds have felt the pressure of a steady climb in Treasury yields, leaving the Bloomberg 10-Year Municipal Bond Index on track to post second worst loss in 30 years, behind the first quarter of 2022. A resilient economy, mounting deficit concerns, and competition for investor capital from the AI buildout have all contributed to the upward pressure on rates. Oil prices have added to the strain amid escalating Middle East tensions. The market has pivoted from expecting rate cuts in 2026 to anticipating further tightening ahead.
Municipals sold off alongside Treasuries and were further strained by muni-specific dynamics. Rich starting valuations left little cushion when rates moved higher, while record new-issue supply and heavy tax-loss harvesting weighed on the market as the quarter progressed. The losses were most pronounced in intermediate and longer maturities, where fewer buyers were available to absorb the increased selling pressure. The correction was persistent but orderly and not driven by any deterioration in credit.
Through September 30, the 10-year AAA municipal yield had risen 115 basis points during the quarter and 132 basis points year to date (Figure 1), bringing it to more than 100 basis points above its 5-year, 10-year, or 20-year average and to the highest level since 2008. The large rise in yields leaves the Bloomberg 10-Year Municipal Bond Index down -6.07% for the quarter and -5.04% for the year but has created one of the most attractive yield environments in decades.
The selloff has left investors with a meaningfully different starting point. On September 30, the 10-year AAA tax-exempt yield closed at 4.10%, one of its highest levels since 2008.
Municipal yields now compare favorably with other fixed income markets on a taxable-equivalent basis (Figure 2). The increase in yields has also occurred while municipal credit fundamentals remain resilient.
Higher starting yields also change the return profile. Bond prices can still decline if rates rise further, but higher income can offset more of the price impact over time. Figure 3 illustrates how the current starting point provides a larger cushion against additional rate increases while preserving meaningful upside if rates decline
History provides useful context for the importance of starting yield. During prior periods when municipal yields were near current levels, forward returns were generally attractive (Figure 4).
Past returns are not a forecast, but the relationship between starting yield and subsequent returns is worth noting. After the recent selloff, investors gained considerably more income than just a few months ago.
A More Constructive Starting Point for Municipal Investors
The recent selloff has pushed municipal yields to levels rarely seen in the last two decades, materially improving the starting point for investors. Higher income now provides a larger cushion if rates move higher, while lower rates would add price appreciation to an already stronger income base. With credit fundamentals still solid, we view the current market as one of the more attractive municipal entry points in recent history.
Figure 3: Higher Starting Yields Provide More Cushion if Rates Rise
The information provided is hypothetical and for illustrative purposes only. The projections reflect a Yield to Worst of 4.64% and an Option Adjusted Duration of 6.52 for the Bloomberg 10-Year Municipal Bond Index as of 9/30/2026. Returns are modeled over a 12-month period, assuming immediate and sustained interest rate shifts of +100 bps, +50 bps, 0 bps, -50 bps, and -100 bps. Calculations do not account for any spread widening or tightening that may occur and they do not take into account the potential benefits of active management on a portfolio. Additionally, the calculations do not account for the deduction of advisory fees and other expenses or other potentially material economic or market factors which could impact investment performance. The hypothetical results shown do not represent actual or back-tested performance. Hypothetical scenarios have inherent limitations and differ from actual performance, as they reflect model-based outcomes created with the benefit of hindsight. No portion of this illustration, including potential impact to the performance resulting from events described, is guaranteed. The interest rate scenarios provided are intended to present a variety of potential market moves but are not meant to be predictive. For informational purposes only; not intended to be used as investment advice and should not be relied on as such. This is not a solicitation to buy or an offer to sell securities. Information presented is subject to change based on changing market conditions. Data is believed to be from reliable sources, but its accuracy cannot be guaranteed.
Figure 4: Forward Returns Have Historically Been Attractive From These Yield Levels
Cumulative returns shown above were calculated on a monthly basis. All results reflect the reinvestment of dividends and income. *Indicates a yield range of 3.90% − 4.30% at month-end. Investors may experience higher or lower returns, and there is the potential for loss. Returns are gross of management fees, transaction costs, and applicable taxes. This material is for informational purposes only and does not constitute investment advice or a recommendation. Please refer to additional disclosures at the end of this presentation. Past performance is no guarantee of future results. Investors may experience higher or lower returns, and there is the potential for loss. Returns are gross of management fees, transaction costs, and applicable taxes. This material is for informational purposes only and does not constitute investment advice or a recommendation. Past performance is no guarantee of future results.
All material has been obtained from sources believed to be reliable, but its accuracy is not guaranteed. There is no representation or warranty as to the current accuracy of, nor liability for, decisions based on such information. This represents the views and opinions of GW&K Investment Management. It does not constitute investment advice or an offer or solicitation to purchase or sell any security and is subject to change at any time due to changes in market or economic conditions. The comments should not be construed as a recommendation of individual holdings or market sectors, but as an illustration of broader themes.
All material has been obtained from sources believed to be reliable, but its accuracy is not guaranteed. There is no representation or warranty as to the current accuracy of, nor liability for, decisions based on such information. This represents the views and opinions of GW&K and does not constitute investment advice, nor should it be considered predictive of any future market performance.
Keep
Reading
Municipal Bond Market Commentary – 3Q 2026
Municipal Bond | Insight
GW&K’s municipal bond team reviews the third-quarter selloff, resilient credit fundamentals, and the more attractive entry point emerging for investors.
Municipal bonds sold off sharply in September, but higher yields and improved relative value may create a more attractive starting point for investors.
We use cookies to improve your experience on our website. To accept cookies click Accept & Close, or continue browsing as normal. For more information or to learn how to opt out of cookies, please see our cookie policy.
Municipal bonds have come under pressure as yields rose. Explore what’s driving the selloff, how higher starting yields may affect returns, and how investors may benefit.





Why Investors Should Look Forward After the Recent Muni Selloff
GW&K Municipal Insights | October 2026
Municipal bonds have felt the pressure of a steady climb in Treasury yields, leaving the Bloomberg 10-Year Municipal Bond Index on track to post second worst loss in 30 years, behind the first quarter of 2022. A resilient economy, mounting deficit concerns, and competition for investor capital from the AI buildout have all contributed to the upward pressure on rates. Oil prices have added to the strain amid escalating Middle East tensions. The market has pivoted from expecting rate cuts in 2026 to anticipating further tightening ahead.
Municipals sold off alongside Treasuries and were further strained by muni-specific dynamics. Rich starting valuations left little cushion when rates moved higher, while record new-issue supply and heavy tax-loss harvesting weighed on the market as the quarter progressed. The losses were most pronounced in intermediate and longer maturities, where fewer buyers were available to absorb the increased selling pressure. The correction was persistent but orderly and not driven by any deterioration in credit.
Through September 30, the 10-year AAA municipal yield had risen 115 basis points during the quarter and 132 basis points year to date (Figure 1), bringing it to more than 100 basis points above its 5-year, 10-year, or 20-year average and to the highest level since 2008. The large rise in yields leaves the Bloomberg 10-Year Municipal Bond Index down -6.07% for the quarter and -5.04% for the year but has created one of the most attractive yield environments in decades.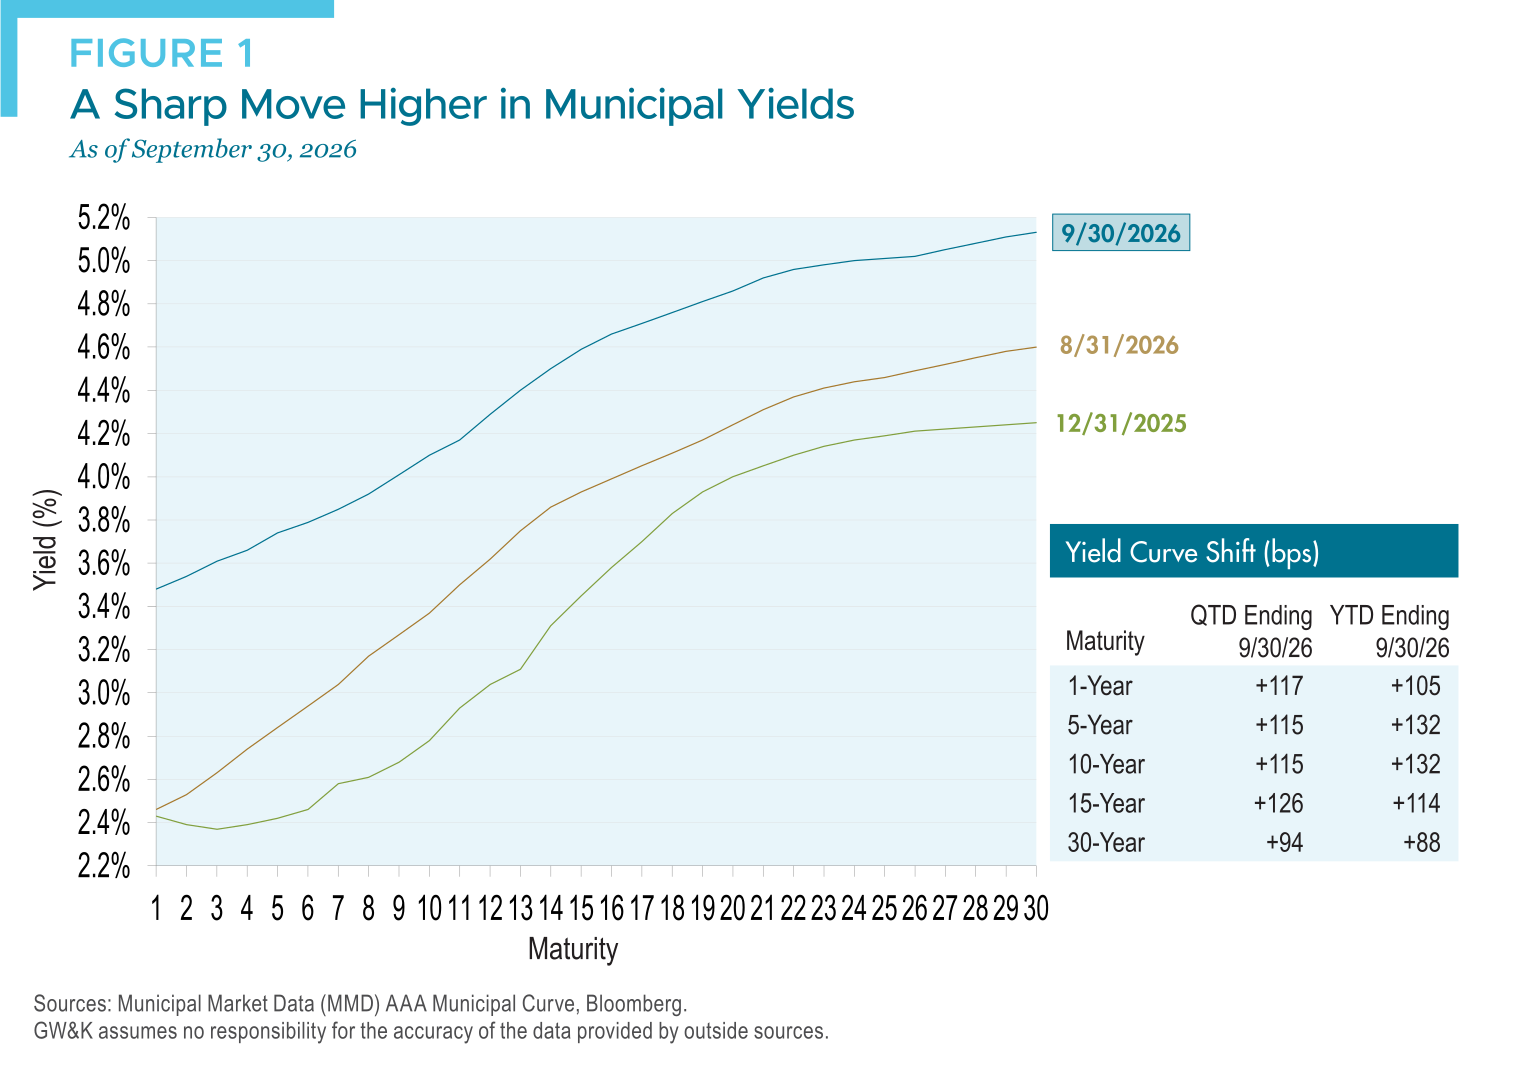
The selloff has left investors with a meaningfully different starting point. On September 30, the 10-year AAA tax-exempt yield closed at 4.10%, one of its highest levels since 2008.
Municipal yields now compare favorably with other fixed income markets on a taxable-equivalent basis (Figure 2). The increase in yields has also occurred while municipal credit fundamentals remain resilient.
Higher starting yields also change the return profile. Bond prices can still decline if rates rise further, but higher income can offset more of the price impact over time. Figure 3 illustrates how the current starting point provides a larger cushion against additional rate increases while preserving meaningful upside if rates decline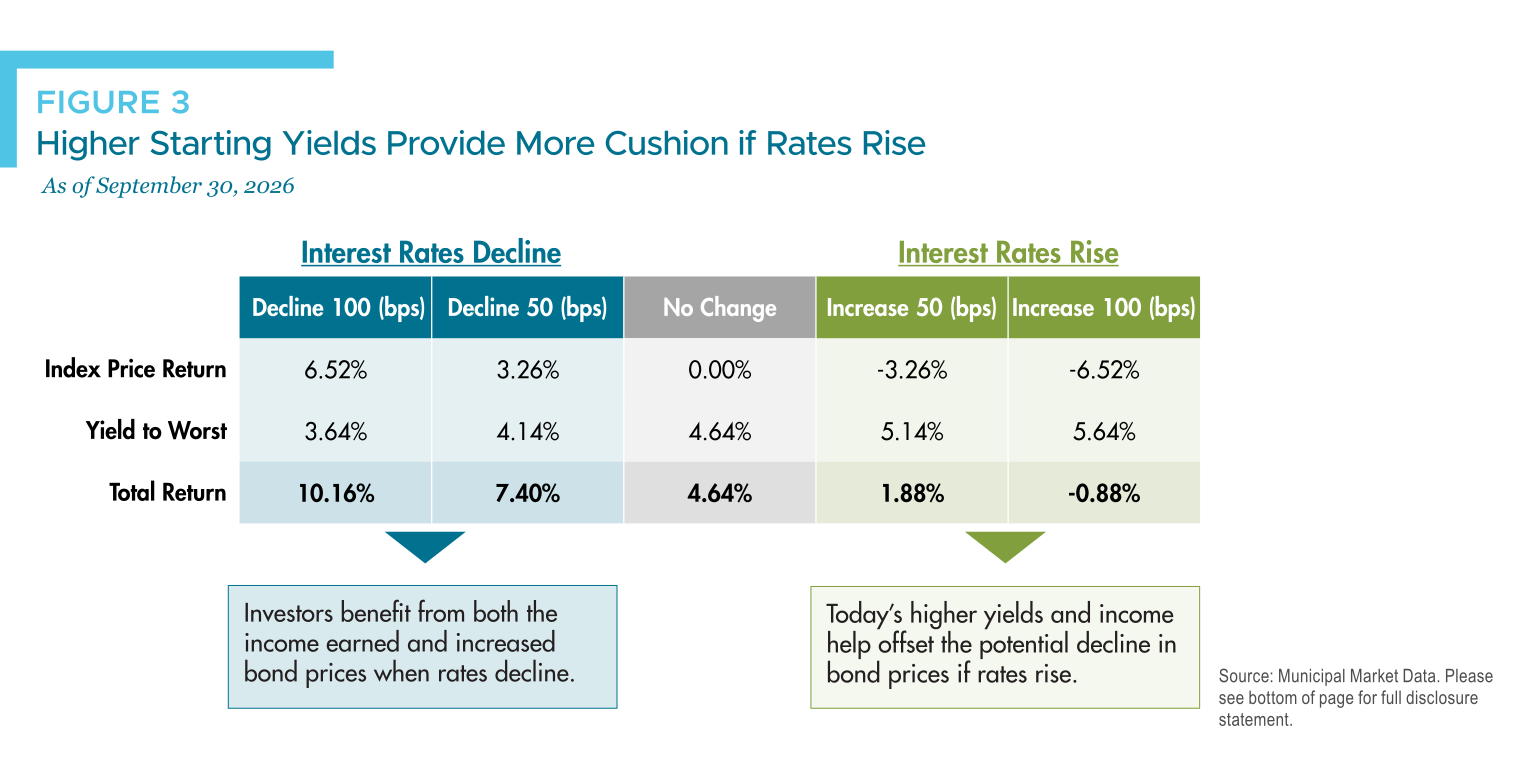
History provides useful context for the importance of starting yield. During prior periods when municipal yields were near current levels, forward returns were generally attractive (Figure 4).
A More Constructive Starting Point for Municipal Investors
The recent selloff has pushed municipal yields to levels rarely seen in the last two decades, materially improving the starting point for investors. Higher income now provides a larger cushion if rates move higher, while lower rates would add price appreciation to an already stronger income base. With credit fundamentals still solid, we view the current market as one of the more attractive municipal entry points in recent history.
Michael V. Rabuffo, CFA
Principal, Client Portfolio ManagerMatthew T. Wheeler, CFA
Client Portfolio ManagerDisclosures
Figure 3: Higher Starting Yields Provide More Cushion if Rates Rise
The information provided is hypothetical and for illustrative purposes only. The projections reflect a Yield to Worst of 4.64% and an Option Adjusted Duration of 6.52 for the Bloomberg 10-Year Municipal Bond Index as of 9/30/2026. Returns are modeled over a 12-month period, assuming immediate and sustained interest rate shifts of +100 bps, +50 bps, 0 bps, -50 bps, and -100 bps. Calculations do not account for any spread widening or tightening that may occur and they do not take into account the potential benefits of active management on a portfolio. Additionally, the calculations do not account for the deduction of advisory fees and other expenses or other potentially material economic or market factors which could impact investment performance. The hypothetical results shown do not represent actual or back-tested performance. Hypothetical scenarios have inherent limitations and differ from actual performance, as they reflect model-based outcomes created with the benefit of hindsight. No portion of this illustration, including potential impact to the performance resulting from events described, is guaranteed. The interest rate scenarios provided are intended to present a variety of potential market moves but are not meant to be predictive. For informational purposes only; not intended to be used as investment advice and should not be relied on as such. This is not a solicitation to buy or an offer to sell securities. Information presented is subject to change based on changing market conditions. Data is believed to be from reliable sources, but its accuracy cannot be guaranteed.
Figure 4: Forward Returns Have Historically Been Attractive From These Yield Levels
Cumulative returns shown above were calculated on a monthly basis. All results reflect the reinvestment of dividends and income. *Indicates a yield range of 3.90% − 4.30% at month-end. Investors may experience higher or lower returns, and there is the potential for loss. Returns are gross of management fees, transaction costs, and applicable taxes. This material is for informational purposes only and does not constitute investment advice or a recommendation. Please refer to additional disclosures at the end of this presentation. Past performance is no guarantee of future results. Investors may experience higher or lower returns, and there is the potential for loss. Returns are gross of management fees, transaction costs, and applicable taxes. This material is for informational purposes only and does not constitute investment advice or a recommendation. Past performance is no guarantee of future results.
All material has been obtained from sources believed to be reliable, but its accuracy is not guaranteed. There is no representation or warranty as to the current accuracy of, nor liability for, decisions based on such information. This represents the views and opinions of GW&K Investment Management. It does not constitute investment advice or an offer or solicitation to purchase or sell any security and is subject to change at any time due to changes in market or economic conditions. The comments should not be construed as a recommendation of individual holdings or market sectors, but as an illustration of broader themes.
All material has been obtained from sources believed to be reliable, but its accuracy is not guaranteed. There is no representation or warranty as to the current accuracy of, nor liability for, decisions based on such information. This represents the views and opinions of GW&K and does not constitute investment advice, nor should it be considered predictive of any future market performance.